By: Sofie diTommaso, Climate Solutions Fellow
 This spring, many programs and events are driving Emory’s commitments to address climate change. Emory’s Climate Action Task Force is collaborating to shape the institution’s climate action planning process; incorporating community input about visions and values for the university shared during Community Conversations; and working on a resilience assessment to identify strengths, vulnerabilities, and opportunities in the face of climate change.
With much spurring climate action forward on campus, it is also timely to reflect on the institution’s greenhouse gas emissions reductions progress to-date. Emory has been tracking its emissions since 2010. Its most recent inventory for Fiscal Year 2021 (FY21) was completed this past October, and the full report is now available.
What is Emory’s GHG Emissions Inventory?
A GHG inventory is an estimate of the institution’s total emissions over a single fiscal year. Emory’s inventory includes data for the Druid Hills university campus, healthcare facilities along the Clifton Corridor, the Briarcliff Campus, and the Clairmont Campus. Creating an inventory allows Emory to estimate its contributions to global emissions, track progress, and identify opportunities for future GHG reductions in a measurable way. It also helps tell the story behind Emory’s emissions trends.
Emissions data is categorized across three scopes, Scope 1, direct emissions, Scope 2, emissions from energy purchased by the institution, and Scope 3, all remaining indirect emissions. Emory includes data from all three scopes within its inventory and currently tracks:
- Stationary Fuels (Scope 1)
- Transportation Fuels (Scope 1)
- Refrigerants (Scope 1)
- Fertilizers (Scope 1)
- Purchased Electricity (Scope 2)
- Waste (Scope 3)
- Wastewater (Scope 3)
- Commuting (Scope 3)
- University Sponsored Air Travel and Study Abroad Travel (Scope 3)
Data, Detective Work, and Documentation: The Inventory Process
A consultant prepared Emory’s FY21 inventory with support from Office of Sustainability Initiatives (OSI) staff. However, the inventory process extended far beyond this small team. The data collection process drew contributions from data stewards and experts across Emory’s campus. In total, fifteen people contributed directly to data included in the inventory, used as background information, or used to make calculations. Many more were consulted along the way.
As the lead OSI contributor for the project, I had the chance to assist the consultant and experience up-close how the many pieces of the inventory fit together. Behind the scenes, this process involved identifying available data and data stewards; meeting with partners across the university to answer questions and problem-solve challenges; cleaning data to match the inventory timeframe and scope; and checking for potential gaps or double-counted information. When gaps in available data arose, the GHG team searched for more context and available data to make informed estimates.
Once complete datasets were compiled, the information was entered into the Sustainability Indicator Management & Analysis Platform (SIMAP), a GHG accounting tool that uses emissions factors to convert the given units to their GHG emissions equivalent. The consultant and OSI staff verified the data and the Office of Institutional Research reviewed and approved the inventory.
Detective work accompanied the data collection process to understand how and why emissions changed across years. Were changes in the data from the previous inventory a result of Covid-19 policies and procedures, methodology changes, programs and projects on campus, behavior change, new data, or something else entirely?
Like any data collection process, Emory’s GHG inventory is influenced by the methods and assumptions used to collect, calculate, and interpret data. For the first time, all protocols used to create Emory’s inventory were thoroughly documented, a step that will improve data transparency and the consistency of future inventories. As such, future inventories will have increased information to draw from and can continue to expand upon and improve the methodologies used.
Emissions Trends for an Unprecedented Year
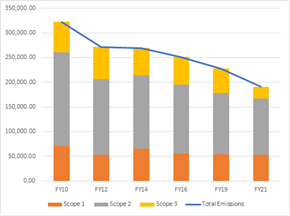
With data spanning September 1, 2020-August 31, 2021, the emissions data for FY21 tells a complicated story for a year highly impacted by the Covid-19 pandemic. The pandemic caused wide-ranging disruptions to the institution, with reductions in campus occupancy, programs, travel, and in-person work accompanied by changes to building operations. As such, making comparisons across years is challenging for this inventory.
Overall, Emory emitted 190,728 MT (Metric Tons) CO2e in FY21, marking a 40.85% reduction since its baseline year of 2010. The impacts of the pandemic most strongly influenced Scope 3 emissions. For example, study abroad data, student commuting, and air travel emissions fell by 99.35%, 87.63%, and 92.88% respectively since the previous inventory in FY19. While direct comparisons are challenging, Emory’s previous inventories do demonstrate a historic pattern of declining emissions across years.
FY21 may be an outlier year; however, you can continue to track Emory’s past and future emissions reductions through its publicly reported Second Nature profile to see how these trends continue to evolve.
Using Data to Inspire Climate Action
In addition to tracking the university’s emissions reduction progress, Emory’s Greenhouse Gas Emissions Inventory can help inform personal climate involvement on campus. Not every source of emissions tracked by Emory can be directly influenced by individual behavior; however, there are choices that members of the Emory community can make to help reduce emissions measured by the inventory:
- Set your thermostat carefully and unplug chargers, lamps, and electronic devices when not in use to avoid excessive energy use.
- Support waste reduction and zero landfill efforts to reduce waste-related emissions.
- Take steps to conserve water.
- Switch up your commute habits by carpooling with friends, riding the Cliff shuttle, using public transportation, biking, or walking.
- Consider alternatives to air travel when possible.
There are also ways to reduce your individual emissions contributions that are not currently reflected in the data Emory tracks in its inventory:
- Pay attention to local food labels in the dining halls and explore plant-forward options.
- Research the most climate friendly form of travel to and from Emory at the start and end of the academic year.
- Make efforts to purchase fewer unnecessary consumer items and invest in items that can be reused multiple times.
On an institutional level, you can support efforts to address climate change at Emory by attending one of the upcoming “Community Conversations” to share your perspective on Emory’s climate future.

Emory’s most recent GHG inventory illustrates a decline in emissions, a trend seen throughout historic inventories. While some of the patterns seen in this inventory are likely to change as the university resumes more pre-pandemic policies and procedures, you can help Emory continue reducing emissions—both on a personal level and by participating in Emory’s current climate planning process!